Zabbix
100 · HealthyEnterprise monitoring for networks, servers, VMs and applications, with templates, triggers and escalations.
Enterprise monitoring for networks, servers, VMs and applications, with templates, triggers and escalations.
Metrics collection and time series database with its own query language (PromQL) and alerting rules.
Observability platform for logs, metrics, traces and real user monitoring, built for low storage costs.
OpenTelemetry-native observability with logs, metrics and traces in one app.
Alert management that pulls in alerts from your monitoring tools, deduplicates and correlates them, and runs workflows.
Observability on ClickHouse that links session replays, logs, metrics, traces and errors in one search.
Dashboards and alerting over metrics, logs and traces from Prometheus, Loki, SQL databases and many other sources.
Log aggregation that indexes labels rather than full text to keep storage cheap, queried from Grafana.
Status pages and uptime monitoring from several regions, with incident updates and alerting.
Health checks for HTTP, TCP, DNS and more, configured in YAML, with alerts and a status page.
Per-second infrastructure monitoring agent with auto-discovered metrics, dashboards and anomaly detection.
Uptime monitor for HTTP, TCP, DNS and more, with status pages and many notification channels.
Application performance monitoring with distributed tracing, service maps and metrics for microservices.
All-in-one platform for uptime checks, status pages, on-call, incidents, logs and APM.
Uptime, response time and server hardware monitoring, with incidents and status pages.
Cron job and background task monitoring that alerts you when expected pings stop arriving.
Status page with built-in monitors, incident history and a polished public page.
Log management with search, alerts and dashboards, designed to be light to run and privacy-friendly.
eBPF-based observability that collects metrics, logs, traces and profiles without code changes and suggests root causes.
OpenTelemetry APM for traces, metrics and logs, stored in ClickHouse.
The code for these is public, but the license is not an OSI open source license, or we have not verified it yet. Check the license notes on each project before relying on it.
Error tracking and performance monitoring; the same code as Sentry's hosted service.
Error tracking that accepts events from Sentry SDKs and runs on a single small server.
Status page system for publishing component status, incidents and scheduled maintenance.
Uptime monitor for HTTP, TCP, DNS and more, with status pages and many notification channels.
Will it still be around?
Healthy
Score 83/100
Can a business use it freely?
Free to use
MIT · open source (permissive)
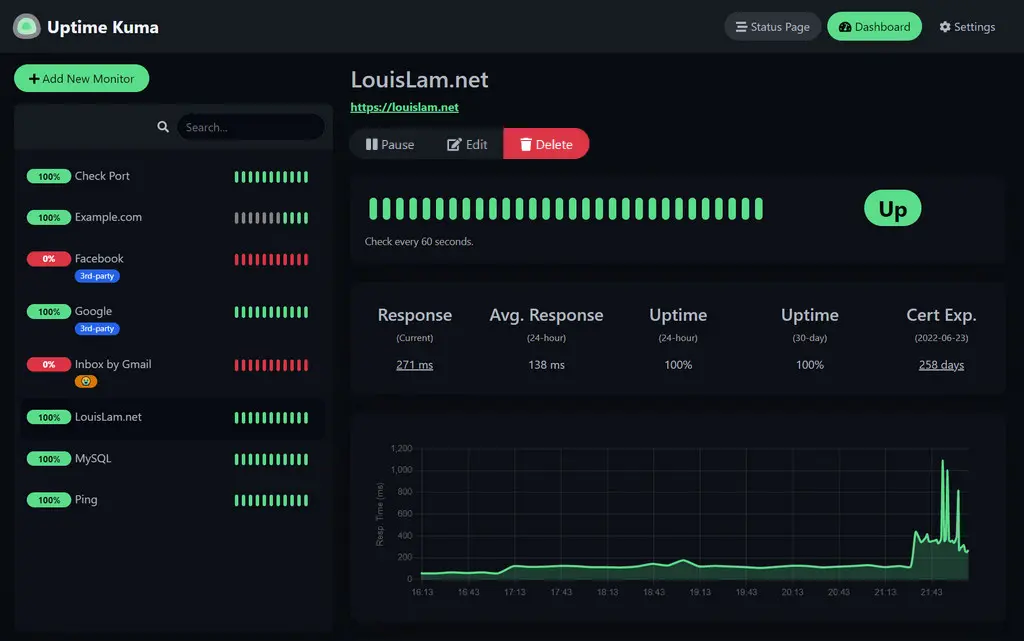
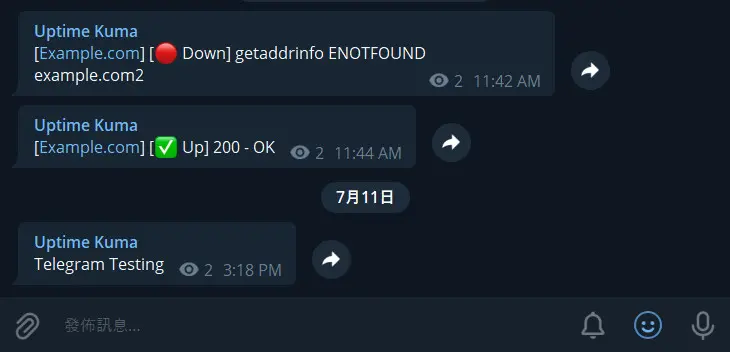
At 10 uptime checks, Pingdom Synthetic Monitoring costs about $18 a month. Uptime Kuma on OpenTools costs $15 a month, setup included, so you save $3 a month, about $108 over three years.
Monthly cost
You save each month
$3/mo
17% less than today
Saving from month one
You save
List price checked 8 Oct 2026 · Source · Disclaimer
Healthy · activity, bus factor and issue responsiveness, from GitHub
Score v2 · How it works
100/100
63/100
75/100
Free to use
MIT · Open source (permissive)
What you need to do
Use, change, host and sell it for any purpose, commercial included, with no license to buy. Keep the copyright notice.
MIT License · Open source (permissive). OSI-approved license with few conditions beyond keeping the copyright notice.
Detected by GitHub as MIT.
Snapshot from 2026-10-08 · Funding: github, open collective
Points for pull requests merged into Uptime Kuma and reviews of them since 10 October 2025. Building something another user asked for earns more. 171 people have points on Uptime Kuma in all.